All projects/Hardware/2025/Completed
CanSat live telemetry dashboard
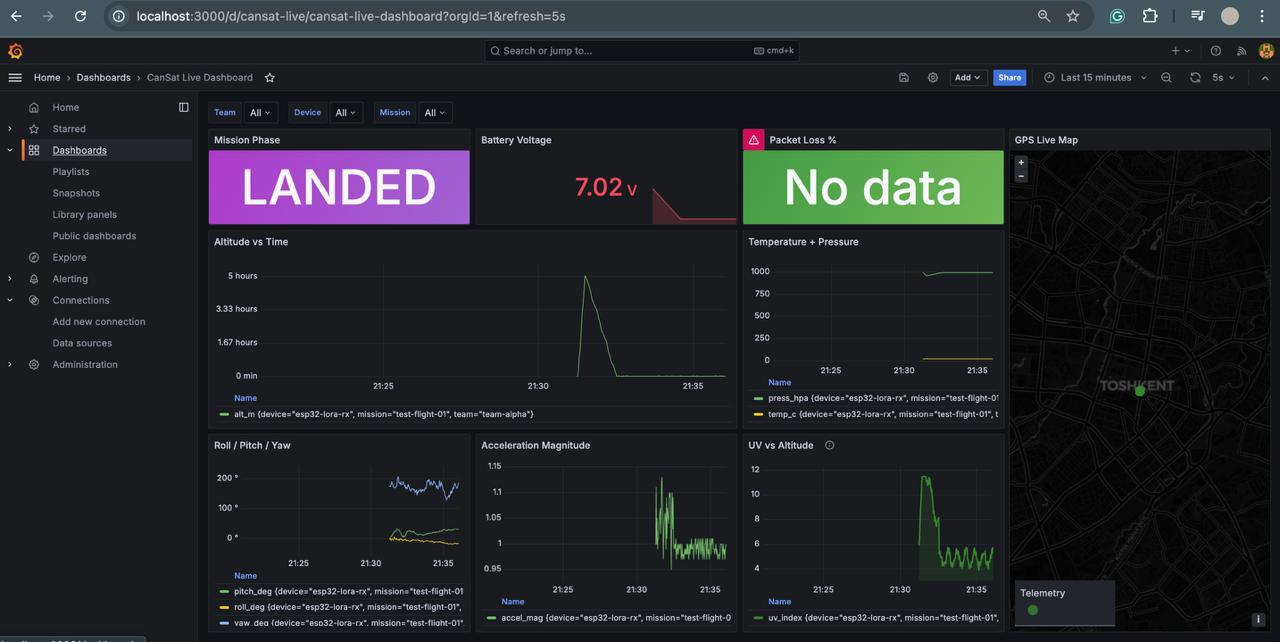
Real-time mission console for CanSat telemetry: a Python bridge parses flight packets into InfluxDB and Grafana shows phase, battery, altitude, pressure, orientation, UV and GPS on one screen.
What I built
- —Python bridge that receives and normalises incoming packets and writes timestamped measurements into InfluxDB.
- —Grafana dashboard built around mission decisions: filters for team, device and mission; priority views for phase, voltage, packet loss, map position and sensor trends; 5-second refresh.
- —Time-series model separating tags from numeric fields so filtering stays fast across missions and post-flight review.
Stack
Grafana · InfluxDB · Python · LoRa / ESP32 feed
Outcomes
- —Operators read one console during flight instead of raw telemetry lines.
- —The same data serves post-flight debugging.
- Refresh
- 5 s
- Dashboard views
- 8+